The near-10% correction in the S&P 500 Index and even larger drawdown in the Nasdaq have gotten a lot of attention this year. What hasn’t gotten as much attention—and maybe surprising to some—is the relative resilience in equity markets outside the U.S. In our special Winter Olympics edition of the Weekly Market Commentary, we hand out medals to the U.S., developed international, and emerging markets. Who do we think will get the gold? Read on to find out.
U.S. Has Been Skiing Uphill
It’s been a rough start to the year for U.S. stocks with some stiff headwinds. The path of the S&P 500 in January looked like something Mikaela Shiffrin might ski on given the steepness of the decline with twists and turns. Fears that the Federal Reserve (Fed) might be behind the curve in its inflation battle got most of the blame for the market selloff, while a few high-profile earnings misses—Meta (Facebook) being the latest—have added to investors’ anxiety levels.
Meanwhile, the international equity markets have held up relatively well. The S&P 500 Index is down 5.6% year to date, outrun by the 3.8% and 0.9% declines in the MSCI EAFE Index (developed international equities) and the MSCI Emerging Markets (EM) Index. To assess which regional market might come out on top at the end of the 2022 competition, we take a look at global fundamentals, valuations, and technicals.
Economic Growth Likely to be a Close Race
Starting with economic growth outlooks, emerging markets may produce the fastest gross domestic product (GDP) growth in 2022, but it could be a close finish [Figure 1].
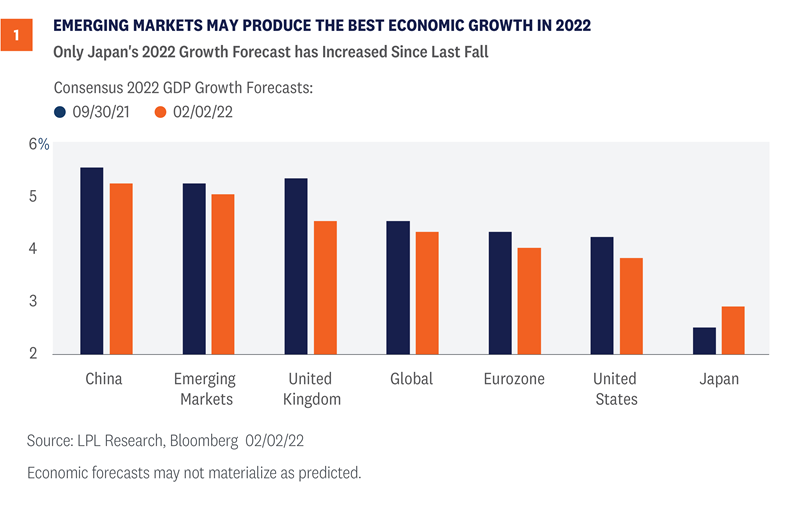
China’s zero-COVID-19 policy may delay the restoration of the EM growth premium while we wait for an eventual end to the pandemic. Meanwhile, distressed property developers present a headwind to growth, though monetary stimulus is helping turn the tide some in China in the near term.
We expect developed international and U.S. economies to generate similar growth in 2022, though rising forecasts for Japan are encouraging. Europe may also see more benefit from pandemic-related pent-up demand as the region is earlier in its economic cycle than the U.S. And U.S. growth has gotten off to a slow start in the first quarter because of the Omicron variant.
U.S. the Clear Favorite in the Earnings Event
The U.S. comes into 2022 as the earnings favorite. Consensus estimates are calling for a 9% increase in S&P 500 earnings this year, ahead of the 5% and 7% increases expected for developed international markets and EM, respectively. As shown in Figure 2, U.S. earnings estimates have marched steadily higher over the past year, outpacing the increases outside of the U.S.
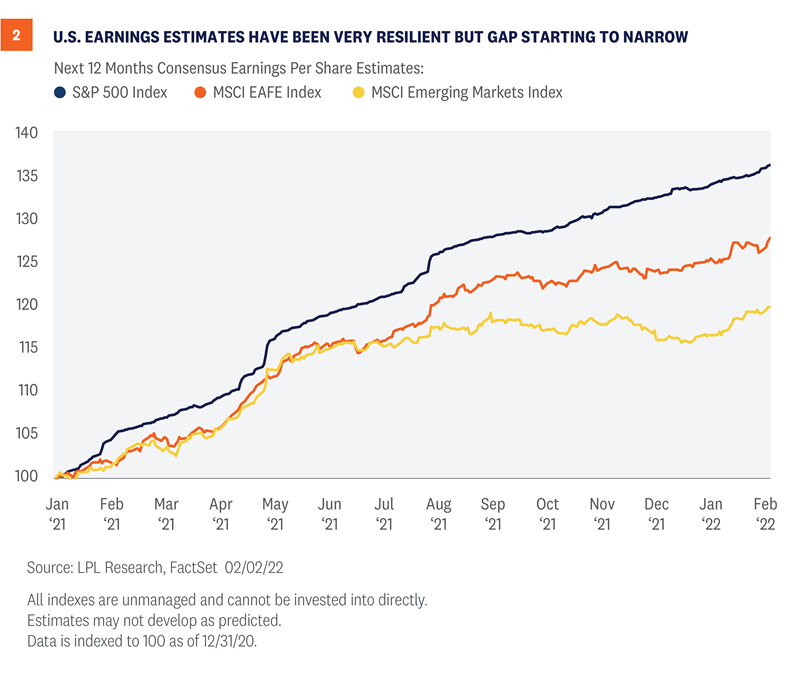
While it’s tempting to think EM will generate better earnings growth because economic growth is better, EM companies have had a difficult time translating economic growth into profits over the past decade (certainly part of the reason why valuations are low in EM, as discussed below). In addition, China’s regulatory crackdown still presents earnings risk even though the headlines have settled down.
On the flip side, the recent increase in EM earnings estimates for 2022 is encouraging (2.7% over the past month, compared to 1.5% for the U.S. and 2.3% for developed international). So while we consider EM an earnings underdog in 2022 and consider it more of a show-me story, it’s only a small hit to its medal hopes.
U.S. Skating on Thin Ice When it Comes to Valuations
The valuation competition is the clearest cut. Figure 3 shows that U.S. stocks continue to trade at a significant premium to their international and EM counterparts and have for a long time.
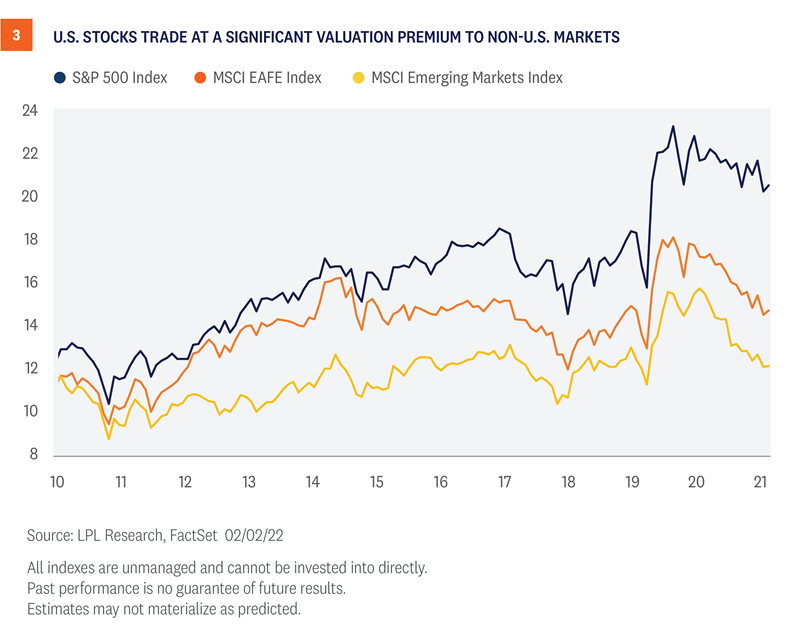
In fact, developed international stocks, measured by the MSCI EAFE Index, are trading at a 28% discount to the S&P 500 on a forward price-to-earnings (PE) basis. That discount is the largest in at least 30 years, and probably much more if we had data going back farther.
Emerging market stock valuations are not in uncharted territory like developed international, but at a 40% discount to the S&P 500’s forward PE, a 20-year low, EM is clearly attractively valued. If we knew the earnings would come through this year, EM would warrant consideration for the gold medal in the valuation competition, but we’ll give it to developed international given the unprecedented discount and greater earnings predictability.
Technicals Still Favor the U.S., For Now
When we compare the charts of developed international and emerging markets to the U.S., the trend still favors a home-country bias. Relative to the S&P 500, both the MSCI EAFE and MSCI EM indexes remain below downward sloping 200-day moving averages, a simple but effective measure of a downtrend.
That said, we’re open to the idea of that trend changing at some point in 2022. Both regions have outperformed the U.S. year to date, but for unique reasons. Developed international markets such as Europe and Japan, which are more value-oriented markets, have benefited from having fewer high-flying tech stocks, while some segments of the Chinese technology sector have finally begun to show signs of stabilization after falling more than 50% last year.
One potential tailwind that could benefit international equities this year is the U.S. dollar. After surprising many investors and rising throughout 2021, the U.S. dollar began to show signs of topping in December. Last week the U.S. Dollar Index suffered its worst week since 2020, and a continued reversal lower should benefit holders of international equities.
Conclusion
Developed international and emerging markets have been making some pretty good runs lately. Many investors expected little out of them coming into this year following a series of slips and falls over the past decade. These markets are more attractively valued, may get a boost if the U.S. dollar weakens, and have seen earnings estimates rise recently, all of which introduce the possibility of a durable shift in global leadership.
But the U.S. is the defending champion. The home team is still in a good position for a silver for economic growth, remains the gold medal favorite in the earnings competition, and possesses a better performance trend than developed international or EM despite the slow start to this year. Our technical analysis work puts the U.S. at least in the hunt for a gold.
The S&P 500’s scores have not kept up with these other markets so far in 2022, but the opening ceremony just happened. We continue to believe U.S. equities could outperform their international and EM counterparts this year, though likely in a much closer race than we saw in 2021.
We put the U.S. as the gold medal favorite, with developed international and EM slightly behind battling it out for silver. Tune in, this should be an entertaining race.
Click here to download a PDF of this report.
______________________________________________________________________________________________
IMPORTANT DISCLOSURES
This material is for general information only and is not intended to provide specific advice or recommendations for any individual. There is no assurance that the views or strategies discussed are suitable for all investors or will yield positive outcomes. Investing involves risks including possible loss of principal. Any economic forecasts set forth may not develop as predicted and are subject to change.
References to markets, asset classes, and sectors are generally regarding the corresponding market index. Indexes are unmanaged statistical composites and cannot be invested into directly. Index performance is not indicative of the performance of any investment and does not reflect fees, expenses, or sales charges. All performance referenced is historical and is no guarantee of future results.
Any company names noted herein are for educational purposes only and not an indication of trading intent or a solicitation of their products or services. LPL Financial doesn’t provide research on individual equities.
All information is believed to be from reliable sources; however, LPL Financial makes no representation as to its completeness or accuracy.
Investing in foreign and emerging markets securities involves special additional risks. These risks include, but are not limited to, currency risk, geopolitical risk, and risk associated with varying accounting standards. Investing in emerging markets may accentuate these risks.
The Standard & Poor’s 500 Index (S&P500) is a capitalization-weighted index of 500 stocks designed to measure performance of the broad domestic economy through changes in the aggregate market value of 500 stocks representing all major industries.
The PE ratio (price-to-earnings ratio) is a measure of the price paid for a share relative to the annual net income or profit earned by the firm per share. It is a financial ratio used for valuation: a higher PE ratio means that investors are paying more for each unit of net income, so the stock is more expensive compared to one with lower PE ratio.
Forward Price To Earnings is a measure of the price-to-earnings ratio (P/E) using forecasted earnings for the P/E calculation. While the earnings used are just an estimate and are not as reliable as current earnings data, there is still benefit in estimated P/E analysis. The forecasted earnings used in the formula can either be for the next 12 months or for the next full-year fiscal period.
Earnings per share (EPS) is the portion of a company’s profit allocated to each outstanding share of common stock. EPS serves as an indicator of a company’s profitability. Earnings per share is generally considered to be the single most important variable in determining a share’s price. It is also a major component used to calculate the price-to-earnings valuation ratio.
All index data from FactSet.
The MSCI EAFE Index is made up of approximately 1,045 equity securities issued by companies located in 19 countries and listed on the stock exchanges of Europe, Australia, and the Far East. All values are expressed in U.S. dollars.
The MSCI Emerging Markets Index is a free float-adjusted market capitalization index that is designed to measure equity market performance of emerging markets. The MSCI Emerging Markets Index consists of the following 21 emerging market country indices: Brazil, Chile, China, Colombia, Czech Republic, Egypt, Hungary, India, Indonesia, Korea, Malaysia, Mexico, Morocco, Peru, Philippines, Poland, Russia, South Africa, Taiwan, Thailand, and Turkey.
US Dollar Index – A measure of the value of the U.S. dollar relative to majority of its most significant trading partners. This index is similar to other trade-weighted indexes, which also use the exchange rates from the same major currencies.
This research material has been prepared by LPL Financial LLC.
Securities and advisory services offered through LPL Financial (LPL), a registered investment advisor and broker-dealer (member FINRA/SIPC). Insurance products are offered through LPL or its licensed affiliates. To the extent you are receiving investment advice from a separately registered independent investment advisor that is not an LPL affiliate, please note LPL makes no representation with respect to such entity.
Not Insured by FDIC/NCUA or Any Other Government Agency | Not Bank/Credit Union Guaranteed | Not Bank/Credit Union Deposits or Obligations | May Lose Value
RES-1033234-0222 | For Public Use | Tracking # 1-05240886 (Exp. 2/23)